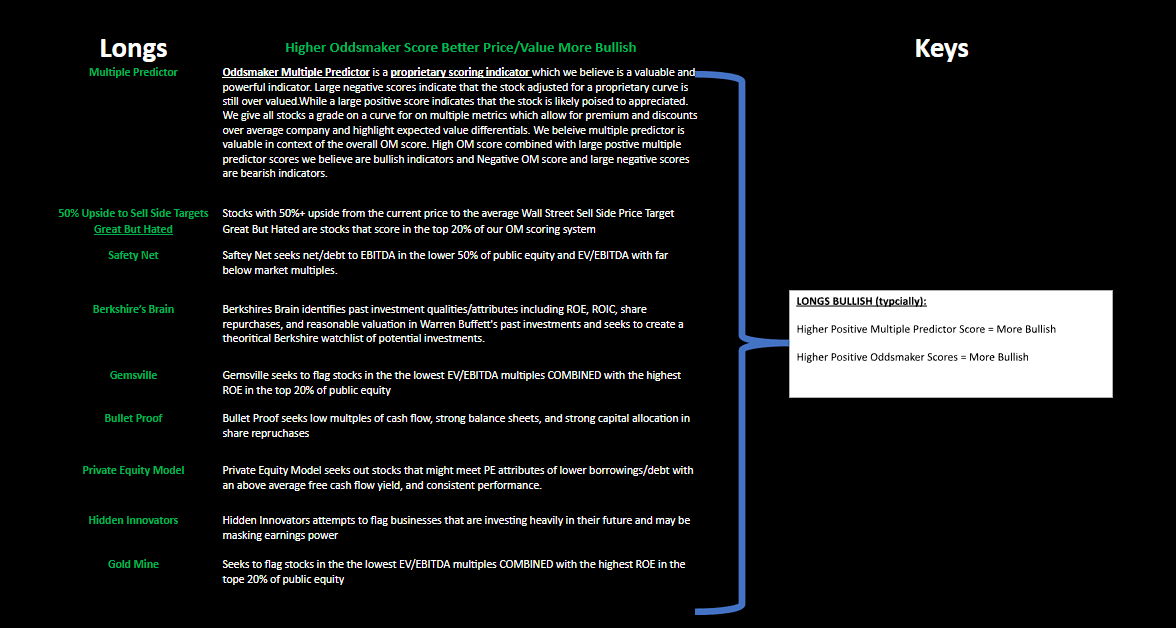
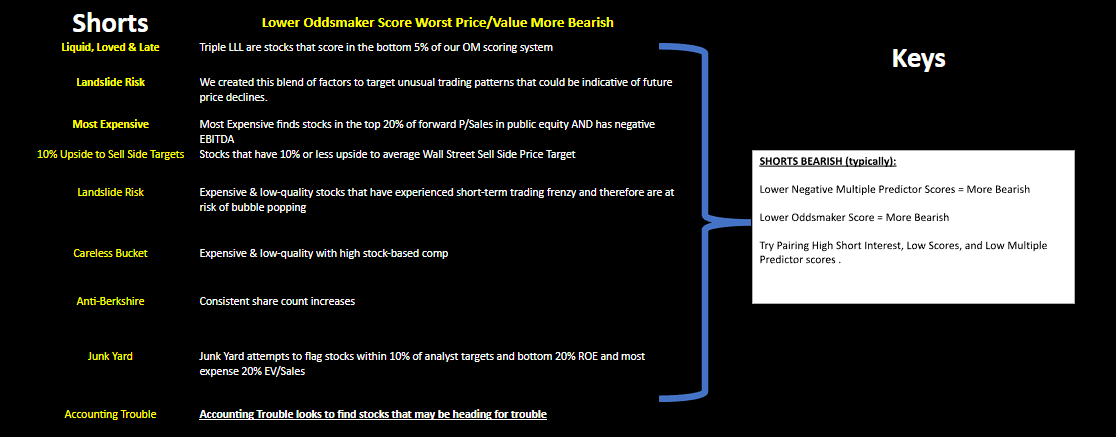
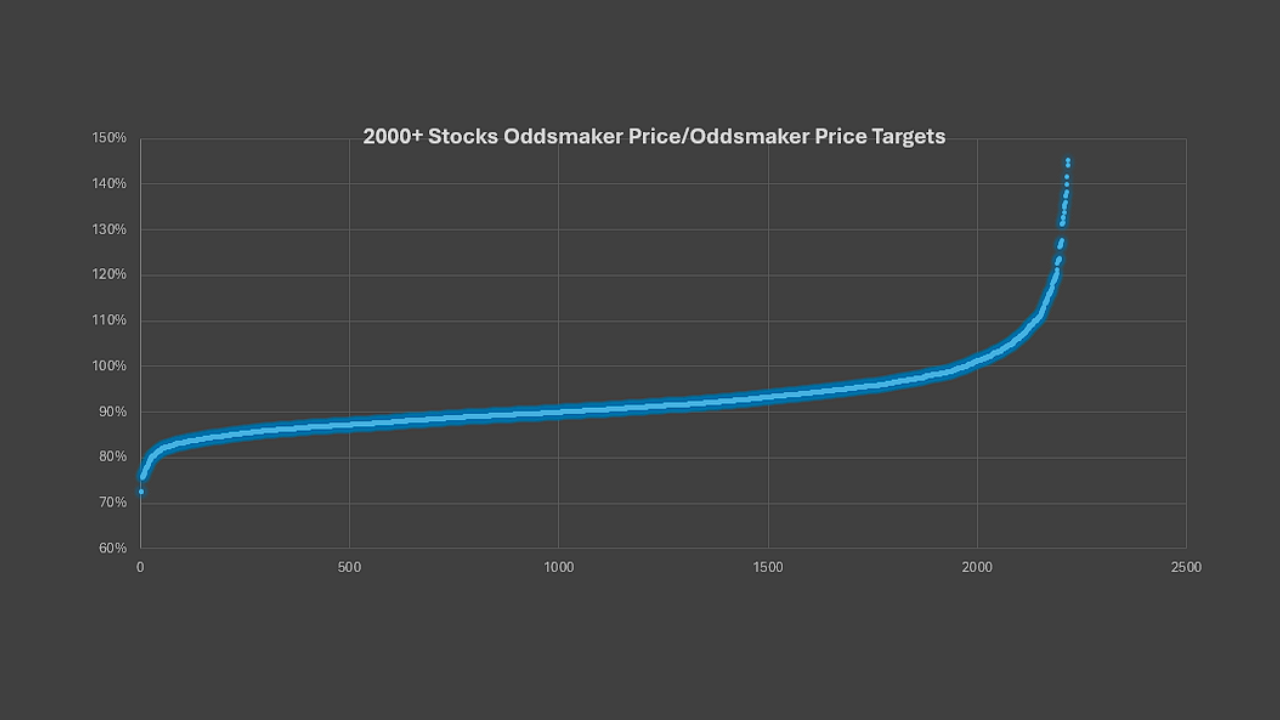
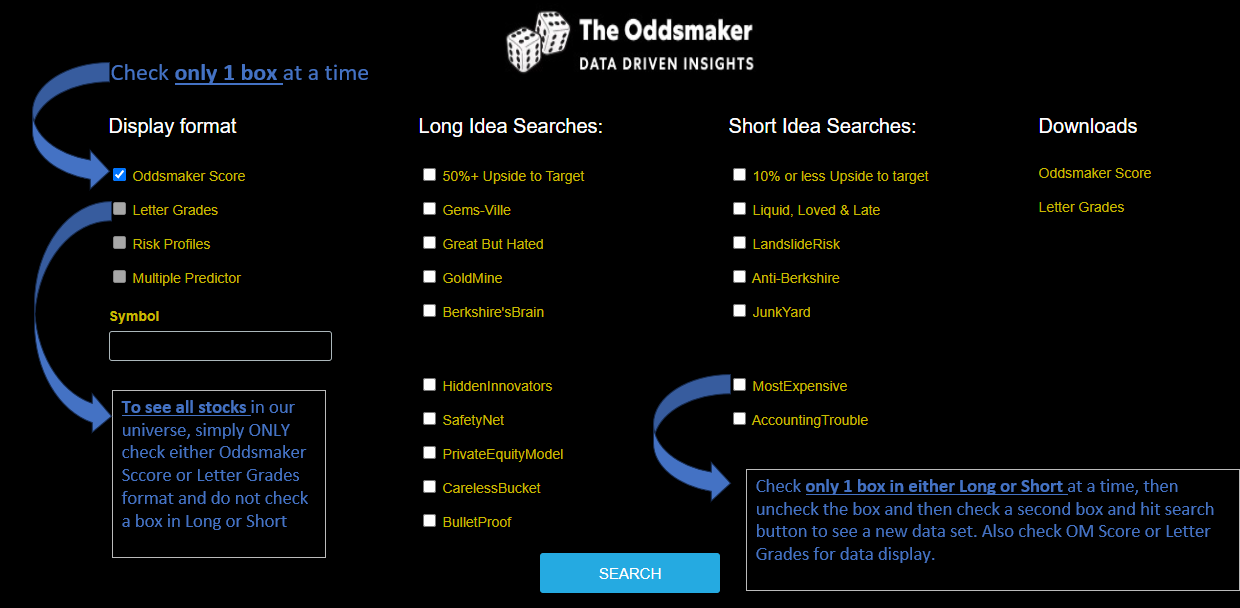
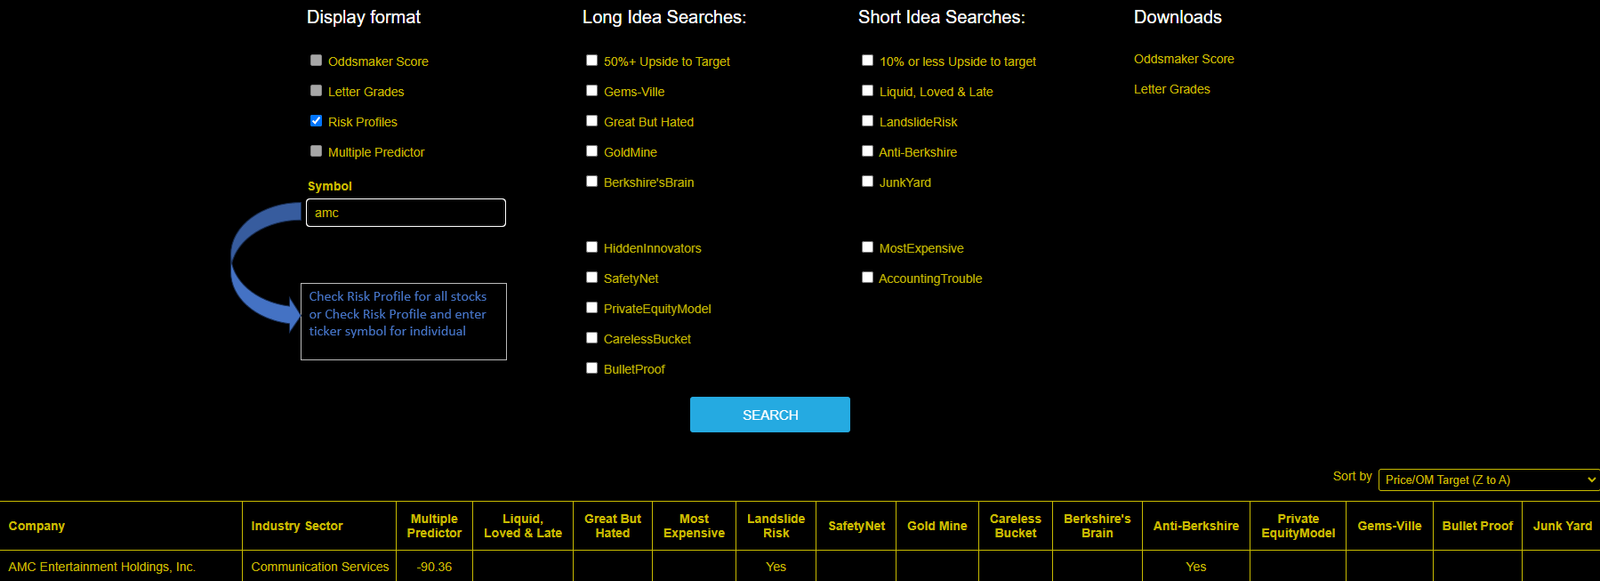
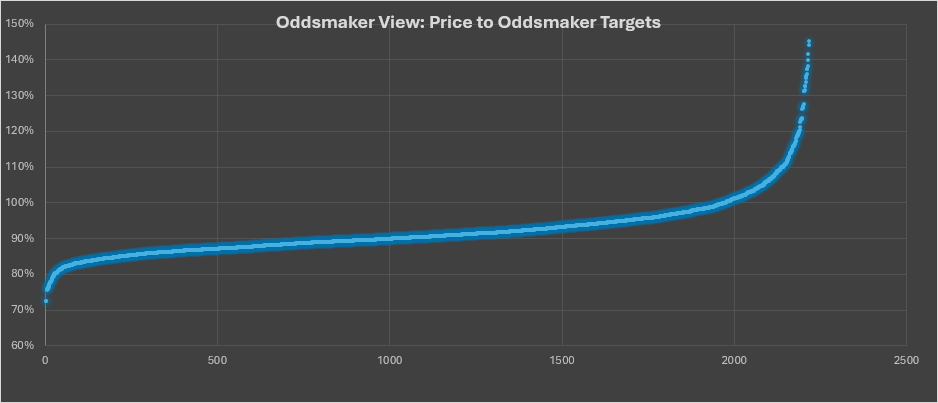
How it works? Tracking roughly 2200 companiesExamining 225 data points per company or 447,441 cells of data being tracked.Advanced analytics to score millions of calculations to sort and understand these data points =IFERROR(IF([@[BalanceSheetRaw]]*1>Letters!$D$2,”A+”,IF([@[BalanceSheetRaw]]*1>Letters!$D$3,”A”,IF([@[BalanceSheetRaw]]*1>Letters!$D$4,”A-“,IF([@[BalanceSheetRaw]]*1>Letters!$D$5,”B+”,IF([@[BalanceSheetRaw]]*1>Letters!$D$6,”B”,IF([@[BalanceSheetRaw]]*1>Letters!$D$7,”B-“,IF([@[BalanceSheetRaw]]*1>Letters!$D$8,”C+”,IF([@[BalanceSheetRaw]]*1>Letters!$D$9,”C”,IF([@[BalanceSheetRaw]]*1>Letters!$D$10,”C-“,IF([@[BalanceSheetRaw]]*1>Letters!$D$11,”D+”,IF([@[BalanceSheetRaw]]*1>Letters!$D$12,”D”,IF([@[BalanceSheetRaw]]*1>Letters!$D$13,”D-“,IF([@[BalanceSheetRaw]]*1>Letters!$D$14,”F+”,IF([@[BalanceSheetRaw]]*1>Letters!$D$15,”F”,IF([@[BalanceSheetRaw]]*1>Letters!$D$16,”F-“,”–“))))))))))))))),”–“) Longs ** Please click on the image to view it in fullscreen. Shorts ** Please click on the image to view it in fullscreen. 2000+ Stocks Target Price ** Please click on the image to view it in fullscreen. Odds Maker Scores Price / Value ** Please click on the image to view it in fullscreen. Application Interface ** Please click on the image to view it in fullscreen. Odds Maker Score View ** Please click on the image to view it in fullscreen. OddsMaker View: Price to Oddsmaker Targets ** Please click on the image to view it in fullscreen.